Distributing Challenge: On Building Highly Engaged Teams
October 4th, 2021I’ve been thinking a lot over the last few years about how vital the distribution of challenge is to a team’s success.
In fact, it’s one of the primary considerations I have when managing.
How many developers do you know who have left their job because either 1) the work is no longer challenging / there is no career growth, or 2) the work is too challenging, and they have no support?
Challenge plays an essential role in our happiness.
However, making sure that everyone on a team, in an org, or in a company is adequately challenged is a complicated task.
In response, I’ve developed a model called the Pyramid of Challenge that I use whenever I am managing others.
The Pyramid of Challenge
The model is composed of a triangle which represents a group’s entire workload. The x axis represents the amount of work available and the y axis represents the complexity of the work available. Together they represent that as work increases in complexity, it decreases in availablity.
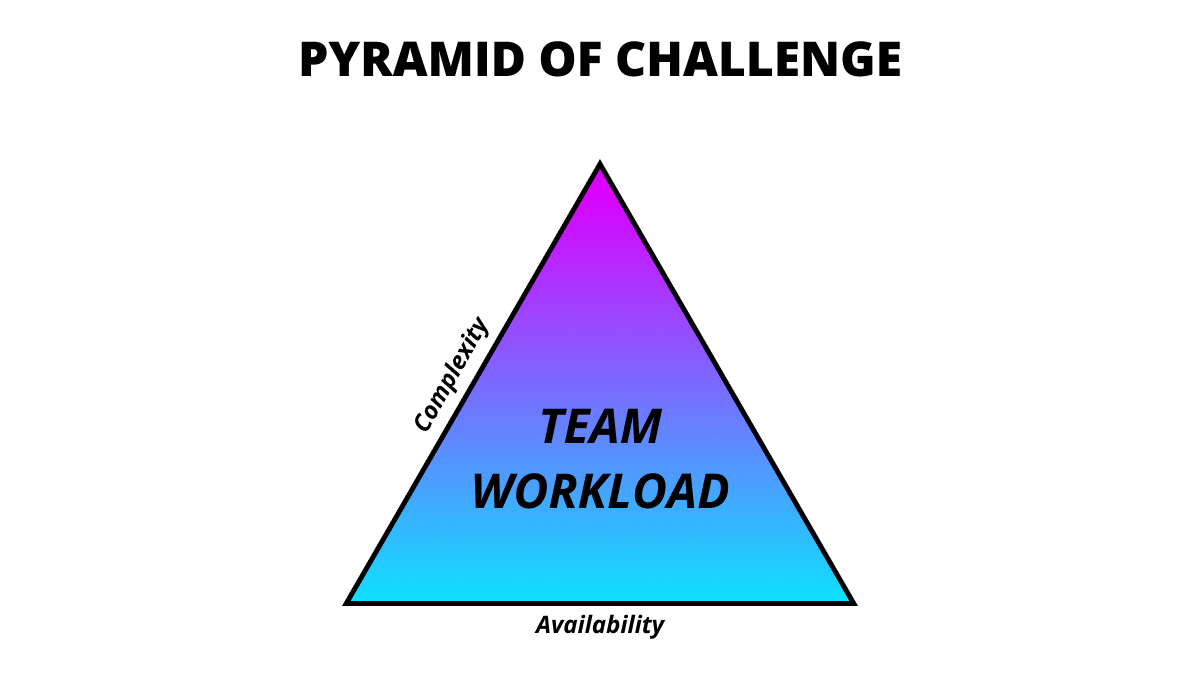
Ensuring everyone is challenged is about ensuring everyone on the team has the correct workload.
Balancing the Distribution of Challenge
In order to have a balanced distribution of challenge, you need a team makeup that doesn’t leave any gaps in the pyramid or put too many people into one part of the pyramid, creating a challenge gap.
A challenge gap is an area of responsibility for a team that doesn’t have anyone challenged by that work.
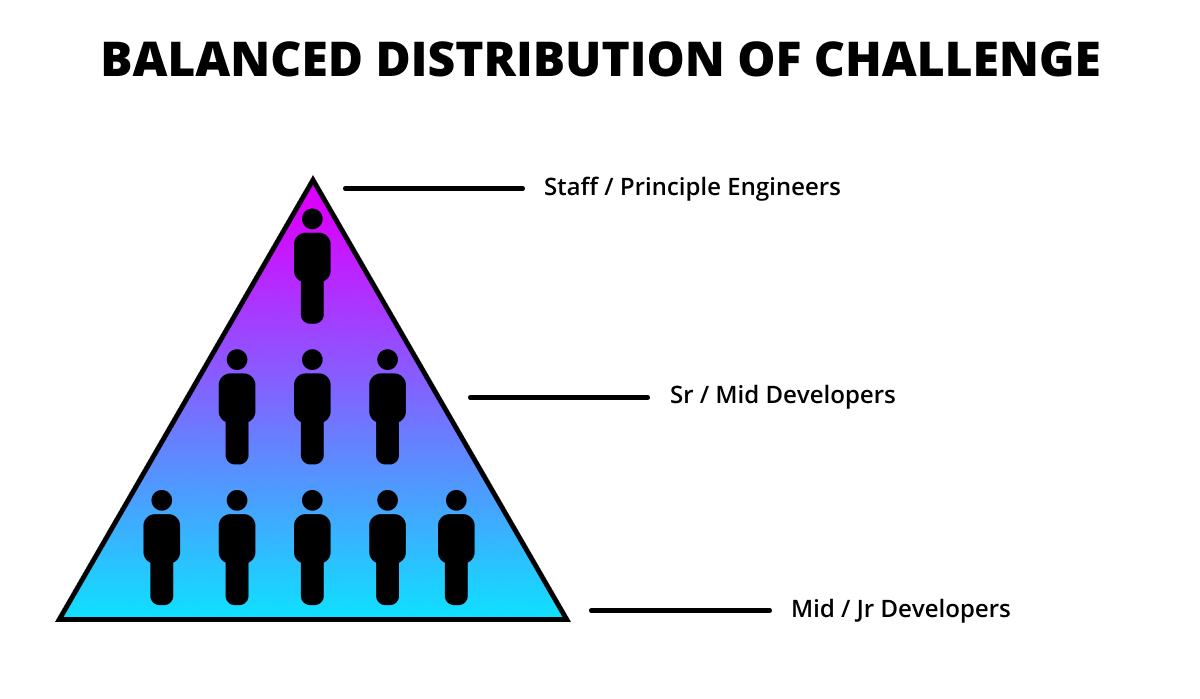
When you compare that previous illustration to most teams today, it’s starkly different. So is this a practical model?
If we apply the model to the responsibilities of a team tasked with building an application, you can see that it holds up. As the work decreases in complexity it increases in availability.
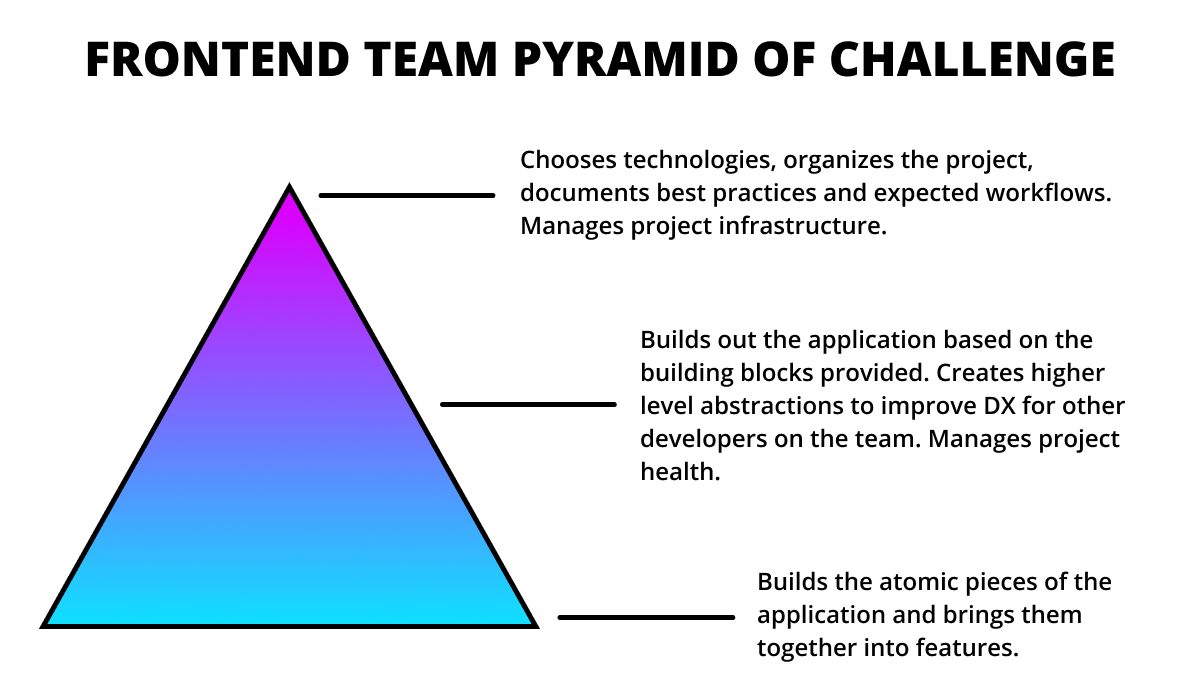
You only need 1 or 2 people to architect an application, but you’ll need many more to build it.
So why is this important?
It’s important because if we don’t provide people with the right level of responsibilities so that they are properly challenged it could grind your team’s productivity to a halt.
With a model to work from, let’s look at some of the most common team makeups you’ll come across and discuss some of the challenge gaps they face.
A challenge gap is an area of responsibility for a team that either doesn’t have anyone challenged by that work, or the work is too challenging for anyone on the team.
Analyzing Common Distributions of Challenge
As we look at these distributions, it’s important to remember that teams will come in all different sizes and makeups, and some teams that fit into one of these common distributions might be really high performing, happy, and engaged.
It’s also very likely that teams will more accurately reflect a combination of these distributions. This model is meant as a guide to help you create a holistic view of your teams makeup according to their experience level and the work available for the team.
Top Distribution of Challenge
Let’s start with the most common distribution of challenge, the top distribution. If a team has too many senior members, it suffers from a challenge gap at the bottom of the pyramid.
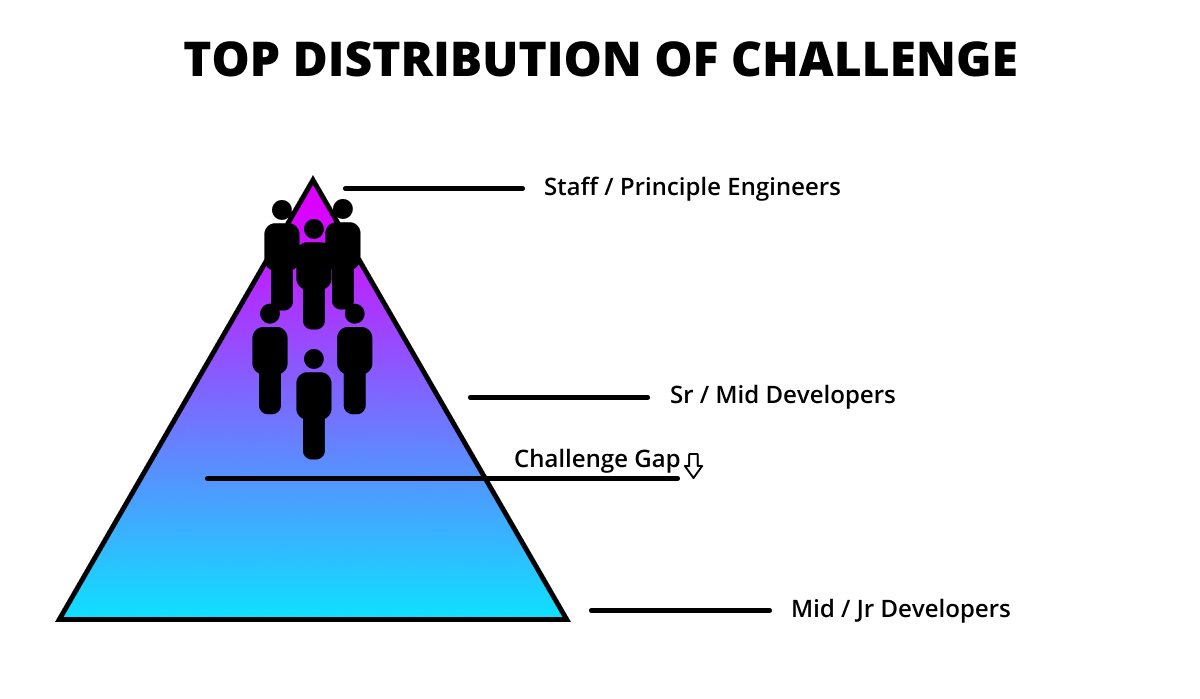
Senior developers are forced to do the less complex and more frequent tasks even though it’s not challenging, essentially leaving them toiling. These teams could suffer from overly complex software, inability to reach consensus, and high turnover as team members leave to seek new challenges.
Bottom Distribution of Challenge
Another makeup we see often is bottom-distributed teams or a team without enough seniorty or leadership. These teams suffer from a challenge gap at the top of the pyramid.
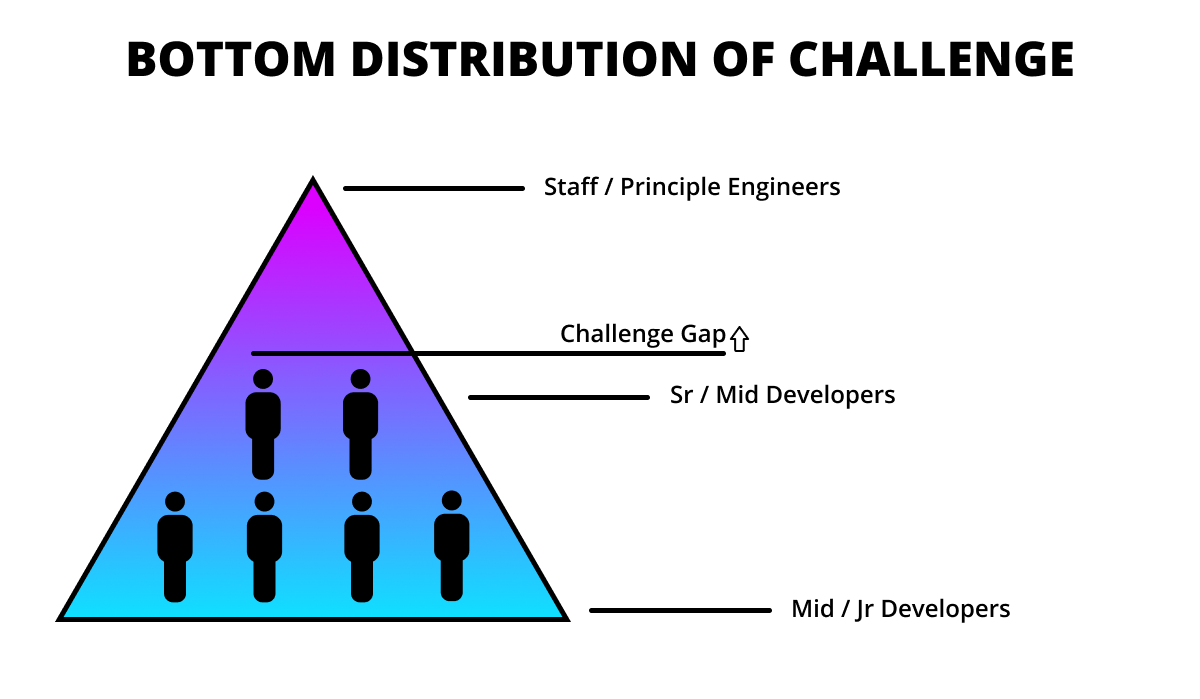
These teams face a situation where they are overchallenged by not having the skills/experience needed to meet their responsibilities. Team members are likely to suffer from burnout and software could be brittle without proper guidance from more experienced developers.
Opposing Distribution of Challenge
Another makeup you might see is the opposing distribution of challenges. These teams tend to have one or two very senior people and then more junior developers.
These teams face a challenge gap at the center of the pyramid.
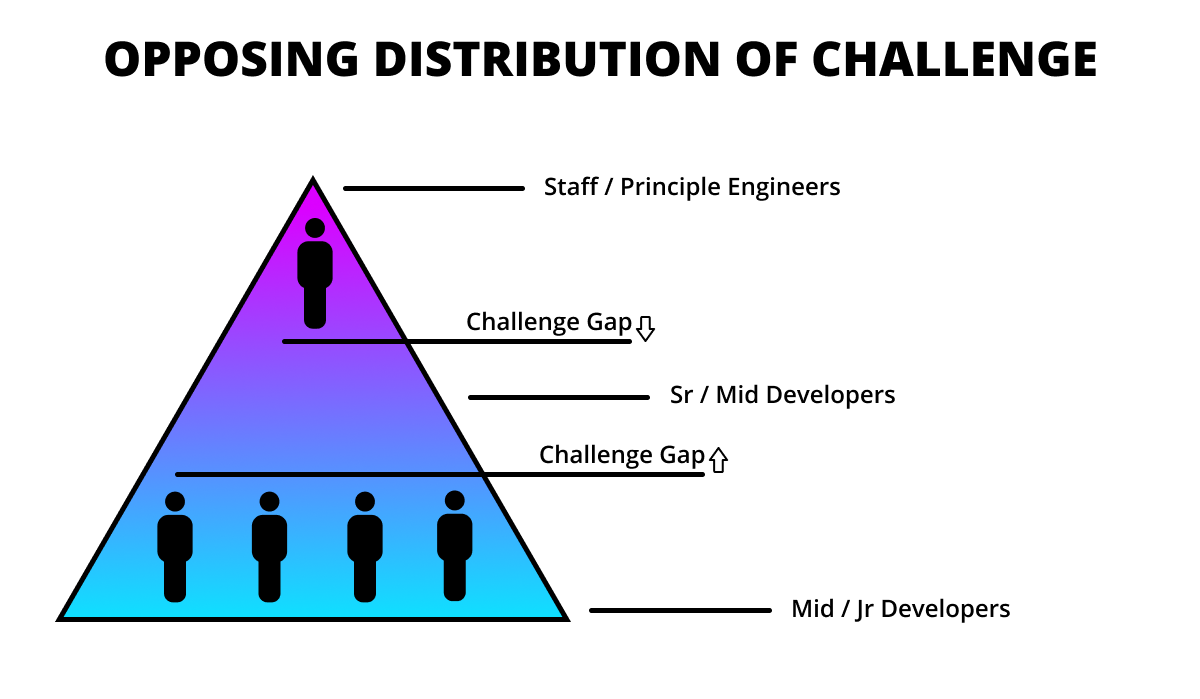
With an opposing distribution of challenges, senior developers will be forced to work on all non-challenging tasks that more junior developers aren’t capable of handling yet, while also tyring to mentoring them.
This will greatly impact their ability to handle their own responsibilities while other responsibilities get dropped or mishandled.
The less experienced developers won’t get the support they need and will often be tasked with work outside their current skillset.
Centered Distribution of Challenge
Lastly, we have a centered distribution of challenges. In this scenario, teams consist of mid-level developers but lack any really senior or more junior developers creating a challenge gap at each end of the pyramid.
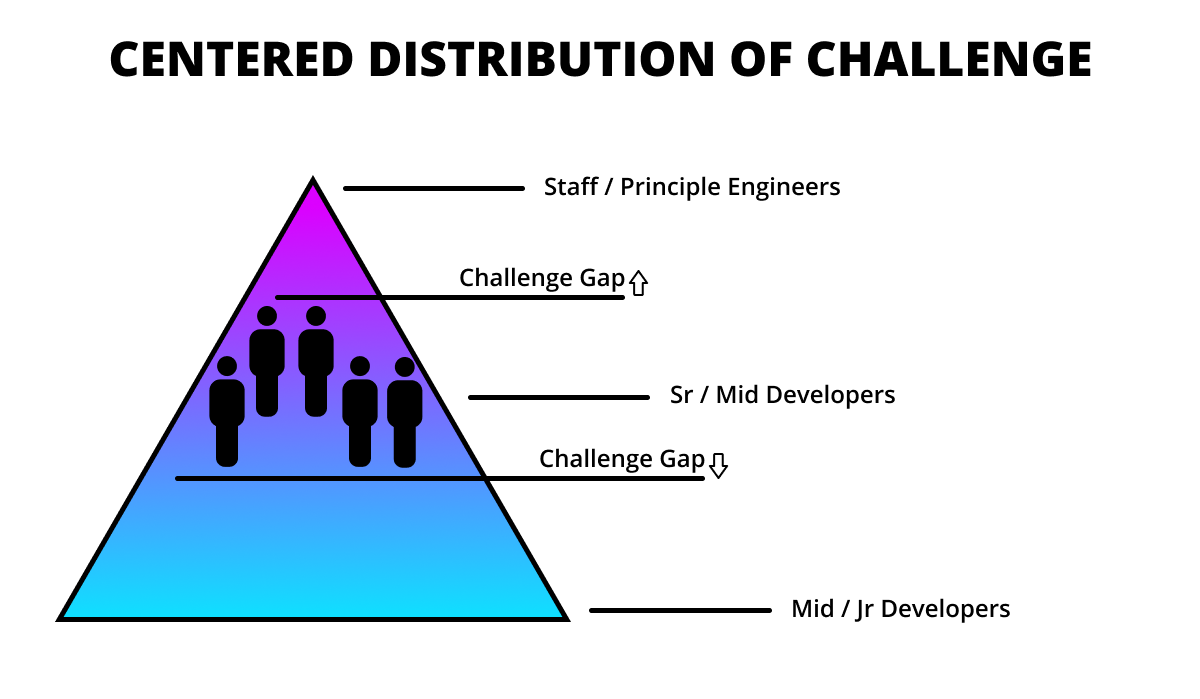
Teams with this makeup are susceptible to infighting around responsibilities looking for work that will fit within their comfort zone. Some of the work could be too complex causing fragility in the solutions.
It’s also possible for teams of this makeup to be very process heavy as team members look for ways to contribute. Some team members may try to step up and take on responsibilities that are too challenging to fill gaps and burnout.
A Framework for Growth
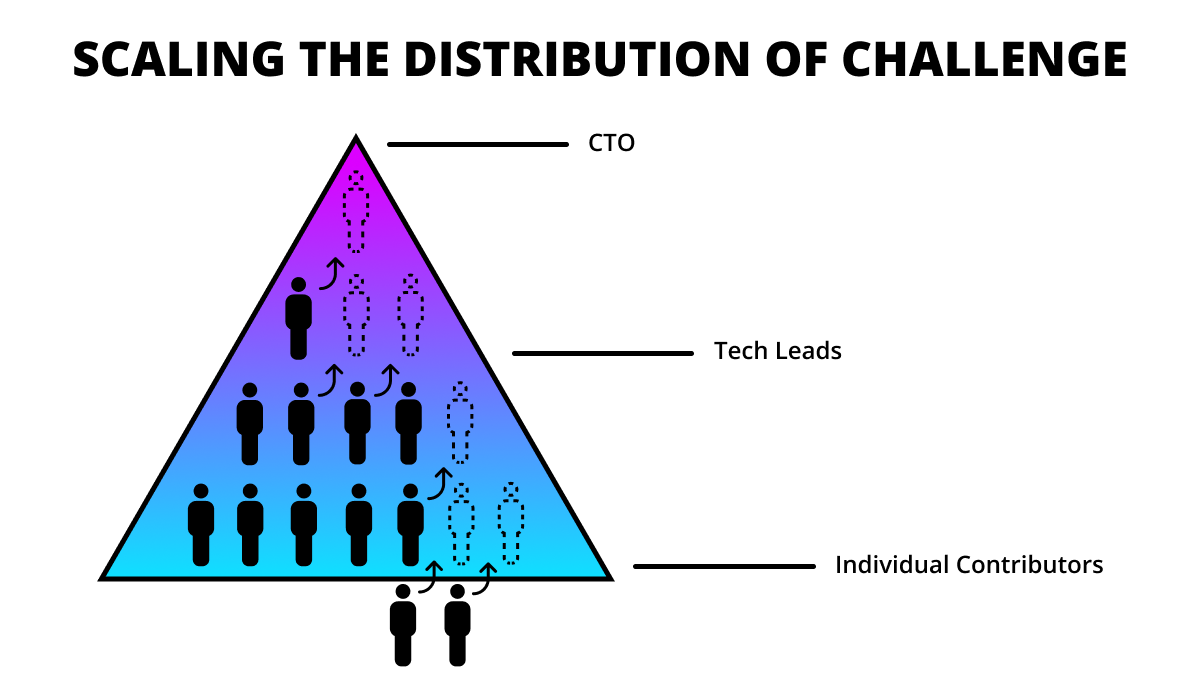
Another significant benefit I’ve found from using this model is that it creates a system that makes it easier to scale a team or teams as you take on more responsibility because the pyramid can be applied to any level of challenge.
Caveats & Conclusion
When it comes to humans we’re better served by communication than models.
While this model might help you identify potential gaps in challenge, it’s more important to constantly check in with your team and make sure they are in fact happy, engaged, and challenged appropriately.